Stop Chasing Data Across Systems
Start Making Decisions That Drive Results
Visuant® transforms scattered business data into clear, actionable insights that help your team perform better, faster, with more accountability
Meet Visuant®
Your Team gets clear visibility, specific actions, and shared accountability.
All in One Place.
Save 10+ Hours Weekly: Eliminate manual reporting with automated dashboards
Improve Performance by 30%: Link every metric to specific corrective actions
Reduce Meeting Time by 50%: Get straight to decisions with pre-populated agendas
Increase Accountability: Every team member knows exactly what they own
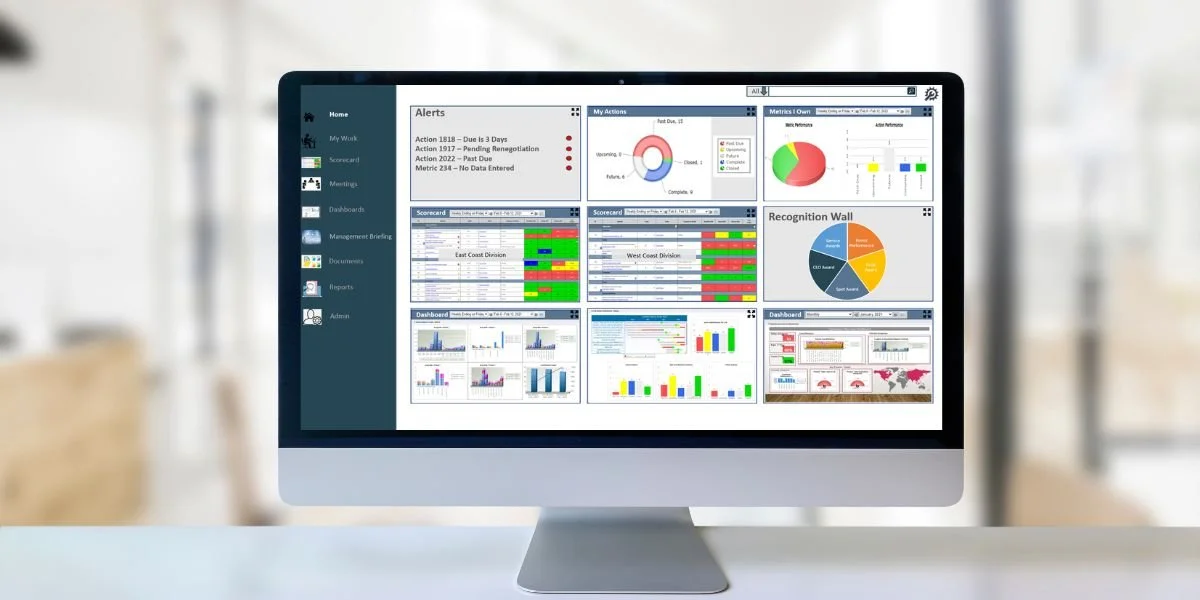
One powerful dashboard
Clarity on what’s working and what’s not
Instant insights into what to do next
Visuant® transforms scattered business data into clear, actionable insights that help your team perform better, faster, with more accountability
Cut reporting time by 75% with automated dashboards
Increase team accountability with linked actions and clear ownership
Make data-driven decisions in real-time, not days later
What People Are Saying
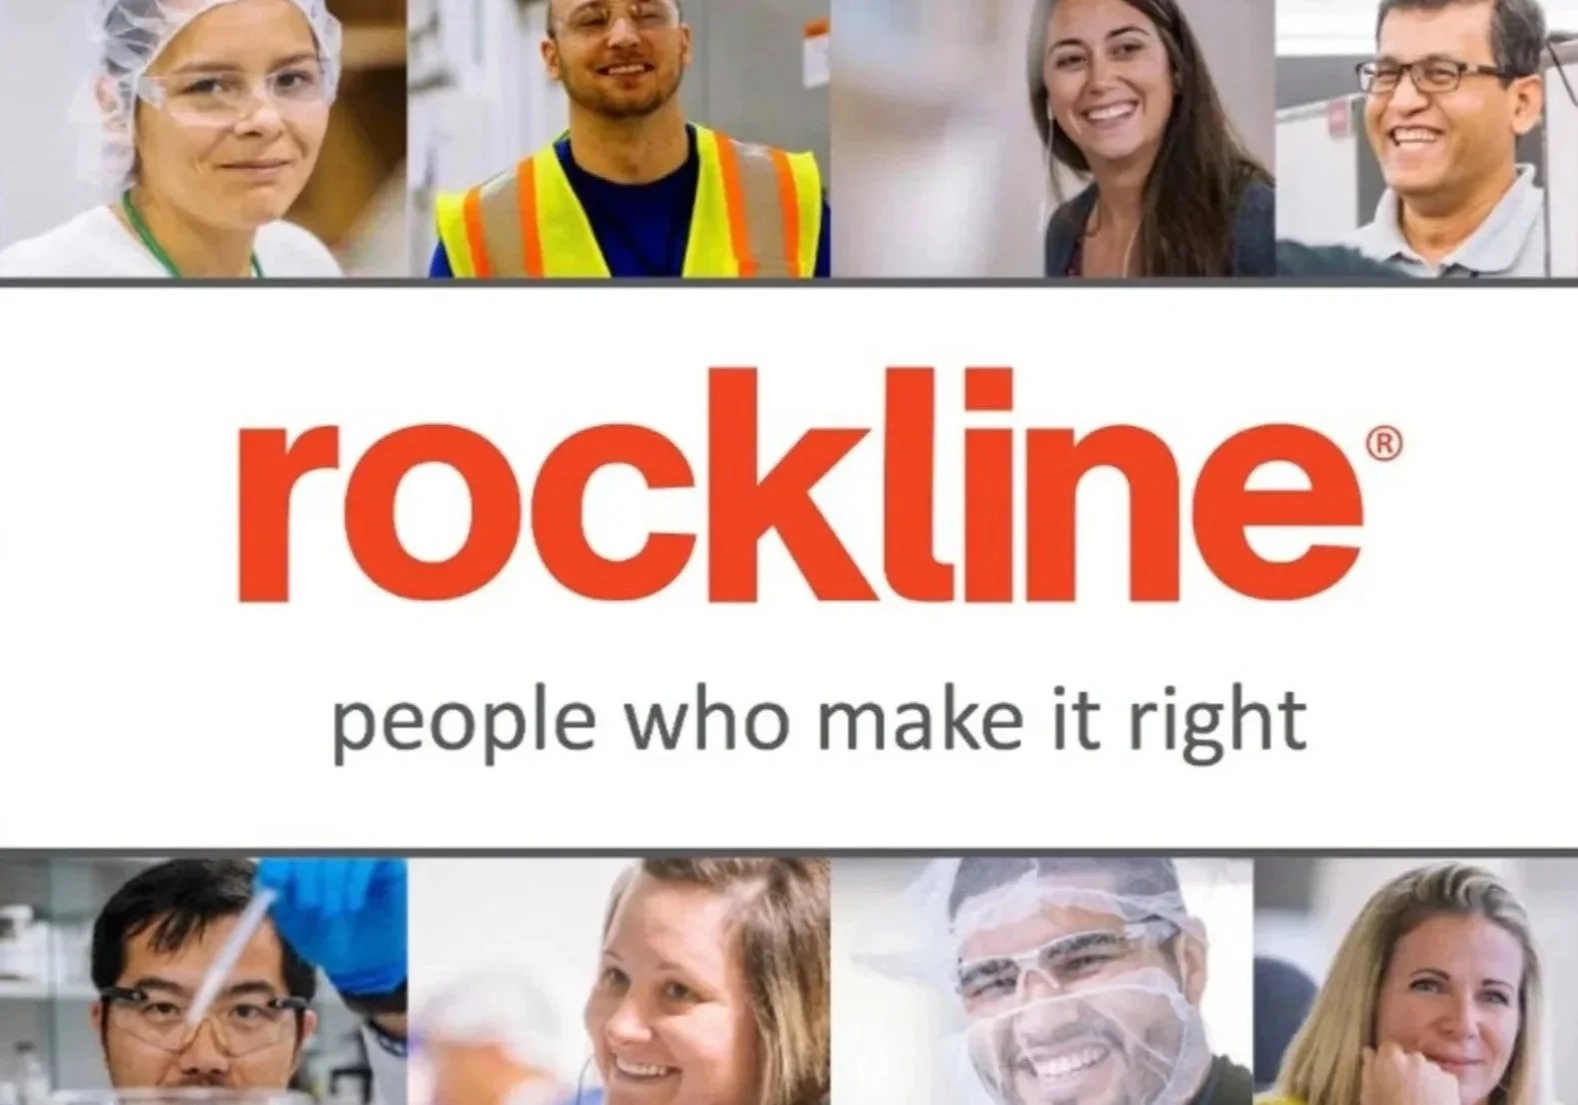
“It gives us the opportunity to see things all in one place. Visuant® is the “one stop shop.” We can go to one place to see all the actions, scorecards, and what’s being done to drive improvement across the business.”
— Frank Hacker, VP of Manufacturing N.A., Rockline Industries

“Visuant® directly enabled us in winning back to back Gold Shingo Awards. Visuant® brought increased visibility to performance and allowed us to focus on areas that needed attention promptly. We were able to make decisions based upon real time data not a gut feel. We saw tremendous improvement in our communication and business performance”
— Col Bruce Elliott (retired), Commander, Rock Island Arsenal

“Our on-time metrics have improved, our quality metrics have improved our employee engagement and people and safety, things that we measure at the SLT level and down through the organization, those all have picked up through augmenting and aligning everyone in a common place.”
— Mike Grant, Director of Operations, Curtiss-Wright
How our Customers are Using Visuant® Software
“With Visuant®, our data is no longer scattered in spreadsheets. It’s one powerful system that drives better performance and decision-making.”
Preston Stevens, Deputy CFO, DeKalb County Government
Ladio Hanzes, General Manager at Rockline Industries, shares how Visuant strengthened plant communication and accountability.
By engaging teams around clear KPIs and consistent leadership routines, Rockline improved equipment effectiveness and achieved a six point increase in OEE.
Zach Paige, General Manager at Alcon Johns Creek, shares how CSI helped transform performance across the organization.
By focusing on alignment and accountability, Alcon turned goals into measurable results and achieved over $20 million in savings.
Pat Rusch, General Manager of Manufacturing at Rockline Industries, shares how aligned leadership transformed performance across a large scale operation.
By standardizing scorecards and unifying leadership around a single system, Rockline improved productivity, achieved world class safety results, and nearly cut employee turnover in half, saving over $400,000 in workforce costs.
Brian Vance, Senior CI Manager at Rustoleum, shares how Competitive Solutions Inc. brought clarity and structure to performance across nine plants.
With consistent scorecards, aligned dashboards, and clear accountability, Rustoleum strengthened decision-making, reduced losses, and improved results with support from Visuant.
The Visuant® Solution
-

Scorecards
Are you winning or losing? Four-Color Scoring provides quick insight into team & organizational performance.
-

Actions
Go beyond viewing data. Drive results with corrective actions directly linked to each KPI.
-

Dashboards
Measure against company targets to get better insights into performance and view historical data trends.
-

Meetings
Facilitate meaningful employee communication regarding business performance and necessary corrective actions.
-

Set Up & Admin
Business Software that is up and running in 72 hours, permission-based, easily add users, create teams and build scorecards.
-
Custom Views
Dynamic Business Scorecards shift with market conditions, success factors & team review for transparent improvement opportunities.
See How Visuant Can Transform Your Team's Performance
Request a Personalized Demo
See what our dashboards, scorecards, and reports can do for you and your company by scheduling a Visuant® Software demo today.
Are you a current Visuant® Customer needing support?